
FootballFan
Well-Known Member
Some background, then will get to what made me excited last week in AQUA Maps.
Last fall when due to weather it looked like we were going to spend significant time in the ICW going from Chesapeake to FL I was looking for all the data I could get.
Went to a cruising seminar while laid over in Southport, NC, gentleman running it showed us the Corp of Engineers survey data. The CoE has survey boats which map the ICW channels and inlets. Frequency of survey varies by CoE district. I downloaded a library of pdf's from each state which when strung together showed the depth survey data for the ICW through NC, SC, GA, and FL. Probably a hundred pages I put into a binder. Downloaded charts showed the ICW, with channel markers, and a color display of depth. Shoaling spots were bright red, with deeper water shown as cooler colors (greens and blues).
You can tell whether center, red, or green offers the best path. Found it extremely useful.
Some states are very frequent, some not. I think it was NC that was surveying the entire route every year. SC was a two year cycle. FL was pretty current for the most part - most of the data was in the 1-3 year range.
An important caveat - those in FL know that shoaling info is sometimes only as current as the last tropical storm that came through. Inlets are particularly affected, long stretches of interior ICW are slower to change.
In my opinion this data should not be taken as an absolute indication of depth, rather a pattern of depth.
Bottom line, this data proved to be extremely useful but was a lot of work to compile and have at the helm to be able to use it.
Captain Rusty talks about when encountering shallow water "hunting" for better water. Unfortunately I don't have the experience in the routes or "intuitiveness" that he does. This tool has helped me know where I am likely to find deeper water in the channel.
A few years ago we could depend on shoaling notes in Active Captain - however it seems like AC is not being updated as much as it was in the past.
Fast forward to last week. Had a 20-30 mile run in the ICW to move the boat since the weather was poor outside. Was updating my chart databases on my iPad, and found a new option in AquaMaps. I have run this stretch of the ICW probably 7-8 times in the last 18 months. Did not expect any problems with the channel, but thought it was a good opportunity to try out this tool.
I still prefer BlueChart for trip planning - but since it does not receive updates I also use Aquamaps.
Ran onto a new option I had not seen before. On the settings page there is an option to include USACE surveys. When you choose the option, you have to re-download your charts. This option requires an additional overlay subscription which is $9.99 per year.
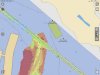
This option inserts the same survey data I had worked so hard for last fall directly into the AquaMap chart. Two views of the same area.
Without survey data:

With Survey data

This example was not the best, just something I grabbed to show the difference. In a lot of cases the the survey data does not always follow the depth contour lines on the charts. What I am looking for here is where to hunt for deeper water.
Granted the problem is the survey data is not as of "today", but in most cases it is newer data than the charts contain in contour lines.
Once again, just a tool. May or may not be useful for you, but I find it incredibly useful. The difference between 5ft and 7ft makes a huge difference to me.
Last fall when due to weather it looked like we were going to spend significant time in the ICW going from Chesapeake to FL I was looking for all the data I could get.
Went to a cruising seminar while laid over in Southport, NC, gentleman running it showed us the Corp of Engineers survey data. The CoE has survey boats which map the ICW channels and inlets. Frequency of survey varies by CoE district. I downloaded a library of pdf's from each state which when strung together showed the depth survey data for the ICW through NC, SC, GA, and FL. Probably a hundred pages I put into a binder. Downloaded charts showed the ICW, with channel markers, and a color display of depth. Shoaling spots were bright red, with deeper water shown as cooler colors (greens and blues).
You can tell whether center, red, or green offers the best path. Found it extremely useful.
Some states are very frequent, some not. I think it was NC that was surveying the entire route every year. SC was a two year cycle. FL was pretty current for the most part - most of the data was in the 1-3 year range.
An important caveat - those in FL know that shoaling info is sometimes only as current as the last tropical storm that came through. Inlets are particularly affected, long stretches of interior ICW are slower to change.
In my opinion this data should not be taken as an absolute indication of depth, rather a pattern of depth.
Bottom line, this data proved to be extremely useful but was a lot of work to compile and have at the helm to be able to use it.
Captain Rusty talks about when encountering shallow water "hunting" for better water. Unfortunately I don't have the experience in the routes or "intuitiveness" that he does. This tool has helped me know where I am likely to find deeper water in the channel.
A few years ago we could depend on shoaling notes in Active Captain - however it seems like AC is not being updated as much as it was in the past.
Fast forward to last week. Had a 20-30 mile run in the ICW to move the boat since the weather was poor outside. Was updating my chart databases on my iPad, and found a new option in AquaMaps. I have run this stretch of the ICW probably 7-8 times in the last 18 months. Did not expect any problems with the channel, but thought it was a good opportunity to try out this tool.
I still prefer BlueChart for trip planning - but since it does not receive updates I also use Aquamaps.
Ran onto a new option I had not seen before. On the settings page there is an option to include USACE surveys. When you choose the option, you have to re-download your charts. This option requires an additional overlay subscription which is $9.99 per year.
This option inserts the same survey data I had worked so hard for last fall directly into the AquaMap chart. Two views of the same area.
Without survey data:
With Survey data
This example was not the best, just something I grabbed to show the difference. In a lot of cases the the survey data does not always follow the depth contour lines on the charts. What I am looking for here is where to hunt for deeper water.
Granted the problem is the survey data is not as of "today", but in most cases it is newer data than the charts contain in contour lines.
Once again, just a tool. May or may not be useful for you, but I find it incredibly useful. The difference between 5ft and 7ft makes a huge difference to me.